The jinfo tool does have disadvantages for some situations. For example, it is not supported in Windows for J2SE 5 and only supports limited functionality in Java SE 6 on Windows. The Diagnostics Tools and Options section of the Troubleshooting Guide for Java SE 6 with HotSpot VM document also points out that jinfo is experimental (subject to change or not even be available in future versions of Sun's Java implementation). See jinfo's Detailed Tool Description for a very clear single-sentence description of the significantly broader jinfo support available in Linux and Solaris OS than the very limited Windows jinfo support.
A final disadvantage of jinfo is its command-line nature. While there are cases where this is advantageous, some people prefer a graphical interface. Finally, another disadvantage of jinfo and the other highly useful command-line tools provided with Sun's JDK is that they are separate tools. It would be nice to have all these tools in one place. That's where VisualVM comes in.
The functionality of jinfo along with several other similar command-line tools and JConsole is now available in the implementation of VisualVM included with the Sun JDK since Java SE 6 Update 7.
One of the nice features of jinfo is the ability to see what System properties are in play for a given Java application. The next three screen snapshots demonstrate how easy it is to see this information with VisualVM (started by running jvisualvm). After that, I'll show an even easier way to see System Properties and JVM Arguments with VisualVM.
Selecting Application and Heap Dump from VisualVM
The first image demonstrates that a Java application (in this case VisualVM itself) needs to be selected and then that application needs to be right-clicked on to select and see the Heap Dump tab (the second screen snapshot).

VisualVM Heap Dump Tab
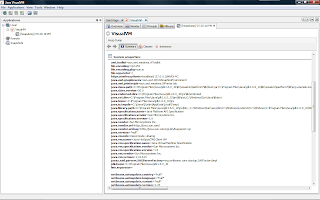
This screen snapshot demonstrates the Heap Dump tab. There is a link to click on to see System Properties. The next screen snapshot demonstrates a piece of the tab when the System Properties has been selected.

System Properties Displayed in VisualVM

System Properties Via VisualVM Overview
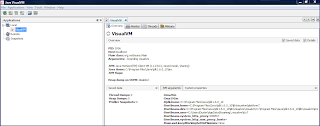
It turns out that it is even easier to see the System Properties with VisualVM than with the Heap Dump process described above. As the next screen snapshot indicates, one can simply use the "Overview" tab after clicking on a particular Java process. The "System properties" sub-tab can be selected to see the system properties.

JVM Arguments
VisualVM also makes it easy to see JVM arguments. The same "Overview" tab in VisualVM just shown has sub-tab for "JVM arguments." When selected, the JVM arguments are shown as depicted in the next screen snapshot.

The previous screen snapshot demonstrates that VisualVM provides the JVM arguments via its "Overview" tab. This same information can also be seen in JConsole in its "VM Summary" tab.
Conclusion
The command-line tools provided with the Sun JDK are very useful. VisualVM offers many of the benefits of these tools with features of its own. In this particular example, VisualVM makes it really easy to access the same type of data that jinfo provides and in addition works well on Windows operating systems. In fact, all of the screen snapshots in this blog entry were taken from VisualVM running on Windows.
No comments:
Post a Comment